
Understand your electricity emissions with Carbon iQ
The first step in reducing your energy-related emissions is understanding where they come from.
We’re making it possible by providing access to an accurate view of your electricity-related CO2 emissions and supporting you with ways to reduce them.
How it works
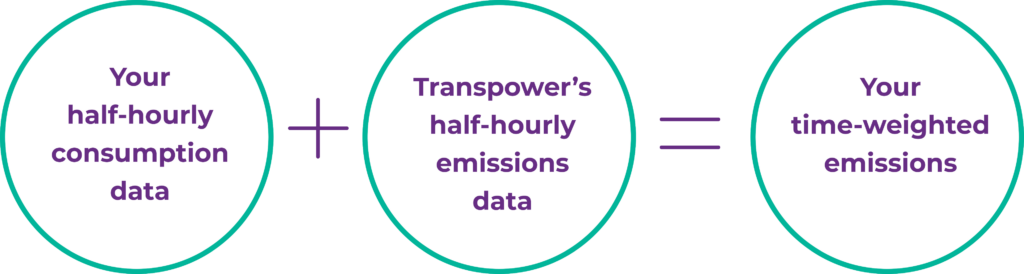
Using Carbon iQ is as easy as uploading your time-of-use or smart meter consumption data. If we supply your energy, we have everything we need already. The platform will then quickly calculate your time-weighted emissions (tons of CO2e) by combining your half-hourly consumption data with the carbon intensity of New Zealand’s electricity system at 17,500+ time periods each year.
Why it matters
Granular emissions reporting is fast becoming best practice worldwide.
It allows for a better understanding of electricity-related CO2 emissions, helps you make informed decisions and speeds the transition to cleaner energy sources.

Accurate Measurement
Get an accurate picture of the emissions generated by your electricity use and the impact of managing it.
Actionable Insight
Interactive charts help identify opportunities to shift your electricity use away from carbon-intensive times.
What you can do with Carbon iQ
Explore your electricity emissions across your portfolio using our interactive tools.
Compare ICPs and sites
Use tags and filtering to delve into your portfolio of sites. View consumption and emissions for each ICP to understand your total electricity emissions footprint.
Spot opportunities to avoid high emission times
View peak emission times on the grid, track your electricity usage during these periods and find opportunities to use electricity at other times.
Generate and export detailed reports
Generate reports on your yearly, monthly, and half-hourly emissions for individual ICPs or your entire portfolio. Export the data to Excel for custom analysis, carbon reporting or audits.
Powered by Energy Market Services
The granular emissions data available through Carbon iQ is powered by em6, one of many services Transpower’s Energy Market Services provides.
Approved for use in Toitū carbon programmes
You can confidently use the data to report your Scope 2 electricity greenhouse gas (GHG) emissions through Toitū carbon programmes*.
*The Transpower em6 methodology and underlying calculations for quantifying ISO 14064-1:2018 category 2 / GHG Protocol Scope 2 electricity greenhouse gas (GHG) emissions have been independently reviewed by Toitū Envirocare. The methodology is suitable for use in an ISO 14064-1:2018 / GHG Protocol compliant inventory and is approved for use in the Toitū carbon programmes.
Lean on our experts
If you’re a heavy energy user or eager to reduce your electricity use during high-carbon periods, consider our additional advisory service. We’ll meet with you regularly, provide analysis assistance and equip you to cut down on electricity during these times.
Want to know more?
Schedule a call with our team to explore how Carbon iQ could help your business achieve its sustainability goals.
FAQs
Using grid-average emissions factors published by the Ministry for the Environment has been the best practice for measuring electricity emissions until now.
While a good proxy, businesses can only report an aggregated annual view of their emissions. Since emissions from electricity fluctuate in line with changes in the generation mix and demand, using grid average emissions factors doesn’t provide a granular view.
Annual Ministry for the Environment (MfE) emissions factors take between 6-18 months to become available, so they don’t give an accurate emissions picture for businesses reporting today. On the other hand, the em6 data used by Carbon iQ is almost instantly accessible and visible in Carbon iQ the next month.
The Transpower em6 methodology and underlying calculations for quantifying ISO 14064-1:2018 category 2 / GHG Protocol Scope 2 electricity greenhouse gas (GHG) emissions have been independently reviewed by Toitū Envirocare. The methodology is suitable for use in an ISO 14064-1:2018 / GHG Protocol compliant inventory and is approved for use in the Toitū carbon programmes.
If you’re not a Toitū member, check with your auditor to ensure they are comfortable with you using this new methodology. If they’re unfamiliar with it, we can help bring them up to speed.
No. If Simply Energy supplies your electricity, we have all the data we need. If your business is supplied by another retailer, you’ll need to request half-hourly consumption data per ICP, which is a common and easy request.
If you have multiple retailers supplying your sites, we can support that scenario too.
Carbon iQ is powered by Simply Energy’s subscription to Transpower’s em6 data. You can export your half-hourly consumption and emissions data from Carbon iQ, but not the grid emissions factor for each trading period.
Transpower em6 started collecting half-hourly carbon intensity data in April 2018 so we can back-date your time-weighted emissions to then. All we require is your historic half-hourly consumption data from your previous retailer(s).
You can lower your emissions and costs if your business can reduce or shift load from carbon-intensive periods such as winter evenings.
This can be achieved easily using our flexibility services, which automatically modify your electricity use in response to the price and carbon intensity of electricity as these change throughout the day.
For example, cold stores or swimming pools might be able to safely reduce some of their heating or cooling during peak times or shift their usage to lower carbon periods. Likewise, a hotel could reduce its emissions by running its laundry services earlier or later in the day, as could a Council with waste-water pumps if they have storage facilities that can be maintained within safe limits.
It varies from day to day depending on the generation mix and demand.
For example, at 6.30 pm on 6 September 2022, our electricity was 81% renewable, increasing to 97% by midnight. Shifting flexible consumption from the evening peak to after midnight on this day would have resulted in a 76% reduction in CO2 emissions. While an extreme case, we’ve found that flexible energy use can reduce emissions by about 30% on most days.
